• 30 N Gould St Ste R Sheridan, WY 82801 USA
  • info@solartro.com
+1 (307) 555-4826

Solar Proposals Design

Precision-Engineered Solar Sales Proposals That Win More Deals — Faster

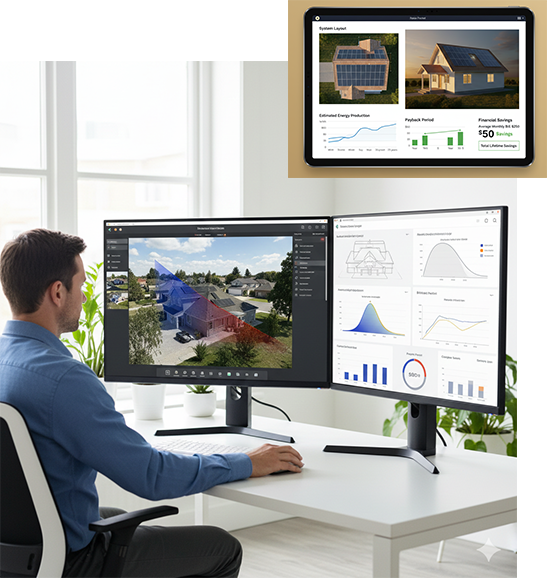
Every solar sale starts with one critical moment: the proposal presentation. In those first few minutes, your client decides whether you're a professional they can trust—or just another salesperson with generic renderings and rough estimates.

At Solartro, we design sales-ready, engineering-accurate solar proposals that combine visual impact, technical precision, and financial clarity—helping installers close more deals with confidence.

From address-only designs to bankable 25-year financial models, our proposals are built to reduce objections, eliminate post-sale revisions, and accelerate approvals.

Whether you're a fast-growing installer closing 10 deals a month or a high-volume EPC managing hundreds of proposals weekly, our designs are engineered for one purpose: converting prospects into signed contracts.

WHAT'S INCLUDED IN A SOLARTRO PROPOSAL DESIGN PACKAGE

We don't create "proposal skins" with rough estimates. Our proposals are engineering-backed, visually compelling, and sales-optimized—combining accuracy with persuasion.

High-Resolution 2D & 3D Visualizations:

  • Photorealistic 3D roof models showing your client's actual property with solar panels installed
    • LiDAR-based accuracy (where available) for precise roof geometry
    • HD satellite imagery integration (Nearmap, Google Earth high-res)
    • Drone-captured aerial mapping (Scanifly-compatible workflows)
  • 2D technical layouts for permit-ready accuracy and installation clarity
    • Module and inverter placement optimized for production
    • String configuration showing electrical design concepts
    • Fire setback compliance visualization (3-foot pathways, AHJ requirements)
    • Obstruction mapping: vents, pipes, skylights, chimneys clearly marked
  • Clean, presentation-ready visuals aligned with your brand
    • Custom logo integration, color schemes, company messaging
    • Professional graphics that inspire confidence, not confusion
    • Mobile-friendly formats for tablet presentations in the field

System Design Highlights:

  • Optimal panel orientation (portrait vs. landscape) and tilt angle
  • Maximum roof utilization while respecting fire codes and aesthetics

Inverter selection and placement strategy (string vs. microinverters)

Detailed Roof & Terrain Analysis:

  • Precise surface modeling:
    • Multiple roof planes with accurate pitch, azimuth, and dimensions
    • Complex roof geometries: hip, gable, mansard, flat—all modeled accurately
    • Terrain elevation mapping for ground-mount systems
  • LiDAR-based accuracy (±1-2 inch precision where available)
    • Roof surface height, slope, and orientation verified via aerial data
    • Eliminates measurement errors that cause post-sale redesigns
  • Drone-based aerial mapping for properties requiring ultra-precision
    • Scanifly-compatible workflows for 3D photogrammetry
    • Real-time property data capture (not outdated satellite imagery)
    • Ideal for complex roofs, commercial buildings, or properties with heavy tree cover

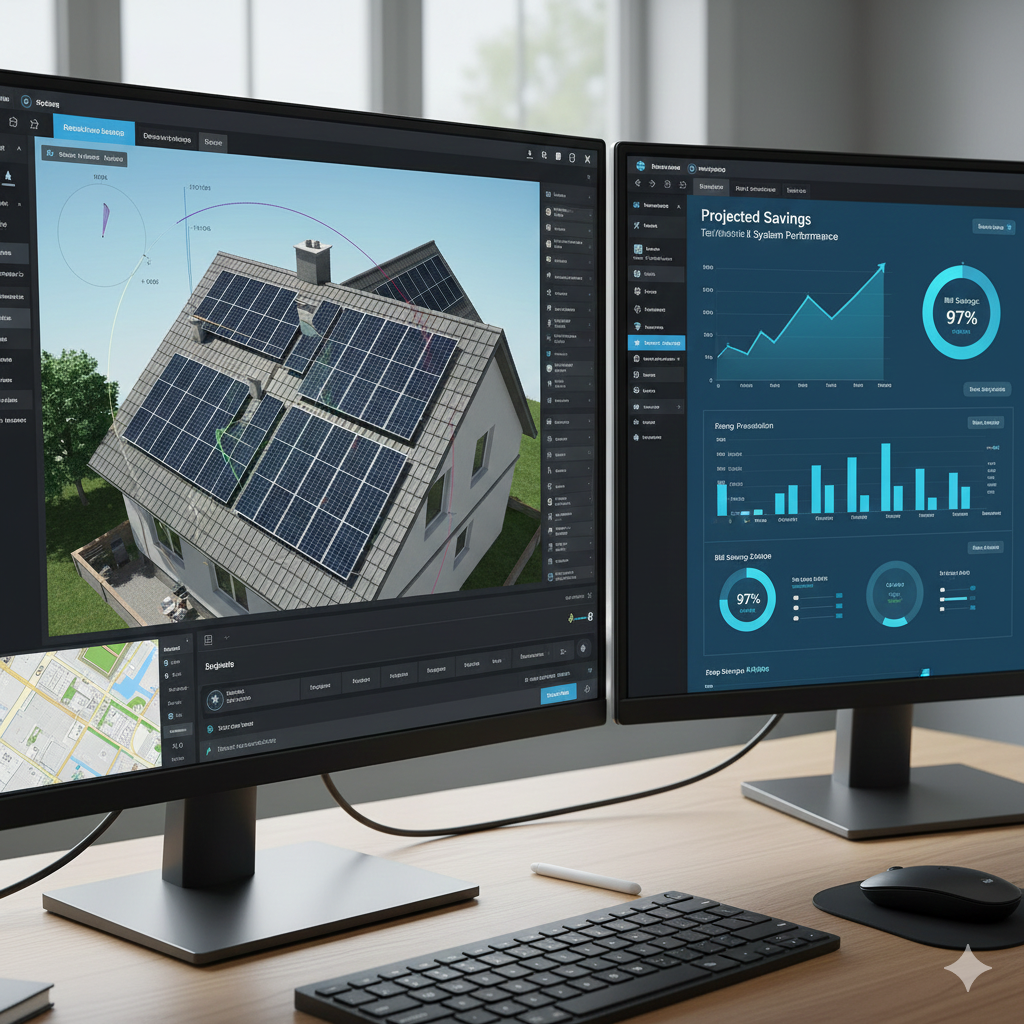
Obstruction & Site Context Modeling:

  • 3D object modeling for realistic visual impact:
    • Trees, chimneys, HVAC units, parapets, skylights modeled in 3D
    • Neighboring buildings and shading sources accurately represented
    • Surrounding landscape context for aesthetic proposals (curb appeal matters!)

Comprehensive Solar Access Evaluation:

Hourly Shading Simulations:

  • 8,760-hour annual analysis (every hour of the year modeled)
  • Sub-hourly obstruction tracking:
    • Trees at different times of day and seasons
    • Chimneys, parapets, and rooftop equipment
    • Neighboring buildings and terrain features
  • Seasonal sun-path visualization:
    • Winter solstice (Dec 21): Critical for worst-case shading assessment
    • Summer solstice (Jun 21): Peak production analysis
    • Equinoxes (Mar/Sep 21): Average performance baseline
  • Bankable shad reports accepted by major rebate authorities:
    • NREL-validated methodology (statistically equivalent to on-site Solmetric/Suneye readings)
    • NYSERDA, MassCEC, ONCOR, utility company approval standards
    • Financing partners trust our shading accuracy (reduces loan rejection risk)

Solar Path & Seasonal Optimization:

  • Climate-specific sun angle data for your project location
  • Azimuth optimization: True south (180°) or slight west-facing for TOU rate offset
  • Bifacial module gain analysis (if using bifacial panels):
    • Rear-side irradiance capture from ground reflection (albedo)
    • Optimized mounting height for maximum bifacial boost
    • Accurate production estimates including backside gain (5-25% depending on installation)

Energy Loss Mitigation Strategies:

  • Shading loss quantification: Percentage of energy lost to obstructions
  • Recommendations for tree trimming or panel relocation to minimize shading
  • Soiling loss assumptions: Dust, pollen, snow accumulation by climate zone
  • Temperature derating: High-temperature losses in hot climates (Arizona, Nevada, Texas)

Roof Integrity & Load Assessment (Proposal-Stage):

  • Roof condition evaluation:
    • Age and material assessment (composition shingle, tile, metal, TPO/EPDM)
    • Visible damage or wear indicators (missing shingles, curling, staining)
    • Estimated remaining lifespan recommendation
  • Snow & wind load assumptions:
    • Design wind speed per ASCE 7 for property location (mph)
    • Ground snow load (PSF) for jurisdiction
    • Confirmation that standard racking systems meet local code requirements
    • Note: Full structural engineering provided in permit design phase

Ground-Mount Terrain Analysis (where applicable):

  • Topographic mapping showing elevation changes and slope
  • Optimal array placement for maximum solar access
  • Access road and maintenance pathway considerations
  • Drainage and erosion control planning (preliminary assessment)

Climate-Specific Derating Factors: We don't use generic national averages—we model your specific climate conditions:

  • Temperature derating: Module efficiency loss at high temperatures
    • Hotter climates (Phoenix, Las Vegas): 8-12% temperature losses
    • Moderate climates (California coast, Pacific Northwest): 3-6% losses
    • Formula: Temperature coefficient × (Average cell temp - STC 25°C)
  • Soiling derating: Dust, pollen, bird droppings, snow
    • Desert environments: 3-7% soiling losses (without regular cleaning)
    • Agricultural areas: 2-5% (pollen, dust)
    • Snowy climates: 1-3% (snow coverage days per year)
  • Snow coverage: Days per year with panel coverage in northern climates
    • Minnesota, Wisconsin, Montana: 10-20 days/year snow coverage losses

We translate engineering data into sales-winning financial clarity:

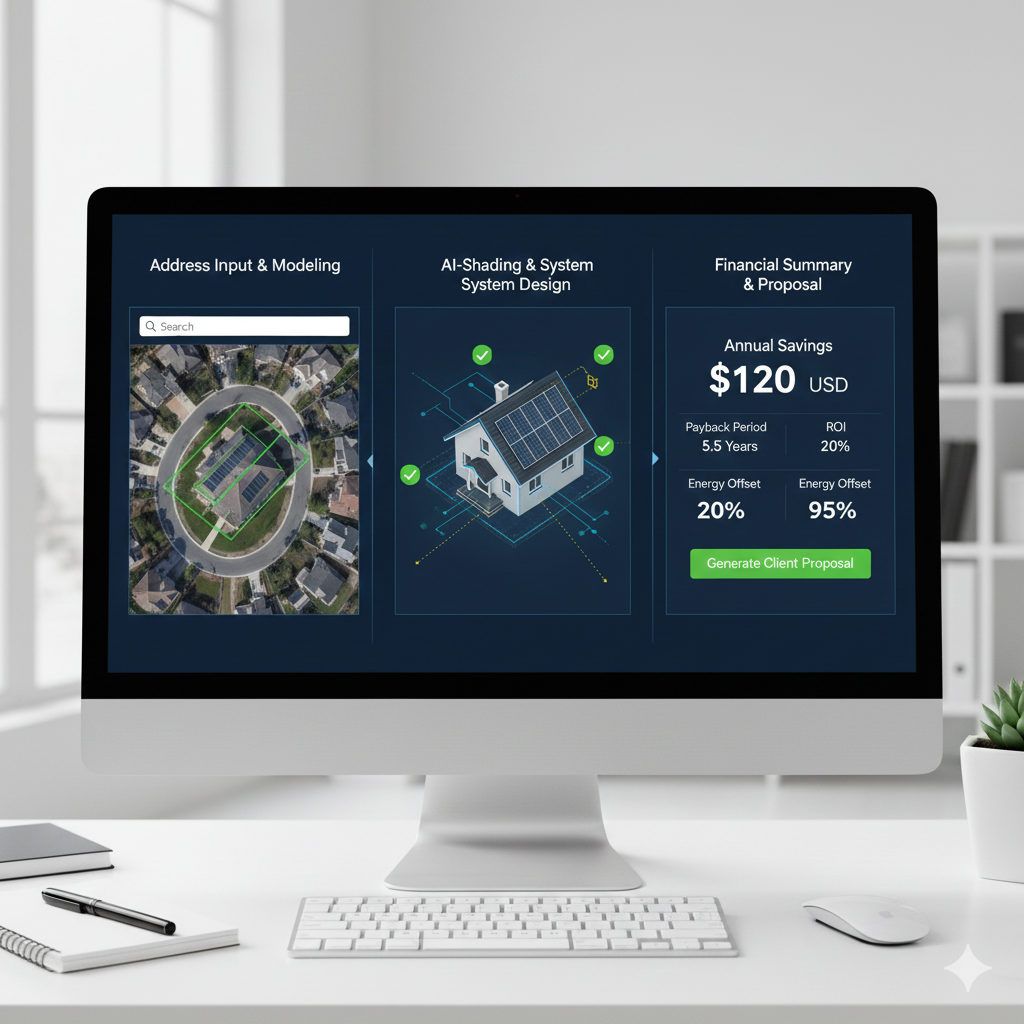
Precise Energy Yield Modeling:

  • Annual kWh production estimate based on:
    • Actual module specifications (efficiency, temp coefficient, degradation rate)
    • Inverter efficiency curves (real-world AC output)
    • Site-specific solar resource data (NREL TMY3 weather files)
    • Shading, soiling, temperature, and system losses applied
  • 25-year degradation-adjusted projections:
    • Year 1 production: 100% (after first-year derate ~2%)
    • Year 2-25: Linear degradation (typically 0.5-0.7% per year for Tier-1 modules)
    • Total lifetime energy production (MWh over system lifespan)
  • Monthly energy breakdown showing seasonal variations:
    • Summer peak production (May-August)
    • Winter production dips (November-January)
    • Helps set realistic client expectations

Current Utility Cost vs. Solar Savings Comparison:

  • Baseline utility analysis:
    • Current monthly electric bill breakdown
    • Rate structure analysis: Tiered rates, Time-of-Use (TOU), demand charges
    • Annual utility cost escalation assumption (typically 3-5% per year)
  • Solar offset calculation:
    • Percentage of energy needs met by solar (70%, 90%, 100%+)
    • Remaining utility costs (if not 100% offset, or net metering scenarios)
    • Net metering credit value (kWh exported to grid at retail rate)

Payback Period Estimation:

  • Simple payback: Total system cost ÷ Annual savings = Years to break even
    • Typical residential: 5-10 years (varies by state, incentives, utility rates)
    • Commercial: 4-8 years (higher rates, better economics)
  • Discounted cash flow analysis: Accounts for time-value of money
    • Net Present Value (NPV) calculation over 25 years
    • Internal Rate of Return (IRR) showing investment performance

Advanced Financial Metrics (for sophisticated clients):

  • Net Present Value (NPV):
    • Total lifetime savings minus system cost, discounted to present value
    • Discount rate assumption (typically 4-6% for conservative modeling)
    • Shows true financial benefit accounting for inflation and opportunity cost
  • Levelized Cost of Energy (LCOE):
    • Total lifetime cost of system ÷ Total lifetime kWh production
    • Expressed as ¢/kWh (e.g., "$0.06/kWh vs. utility $0.14/kWh")
    • Demonstrates solar cost competitiveness vs. grid power
  • Long-term cash flow modeling:
    • Year-by-year cash flow projection (Years 1-25)
    • Cumulative savings graph showing breakeven point and total lifetime value
    • Includes inverter replacement cost assumption (Year 12-15 typically)

Federal & Local Incentive Integration:

  • Federal Investment Tax Credit (ITC):
    • Current rate (30% through 2032, then steps down)
    • Tax credit value calculation (30% of total system cost)
    • Explanation of how tax credit works (reduces federal tax liability)
  • State and local incentives (where applicable):
    • State tax credits (Massachusetts, New York, Arizona, etc.)
    • SREC programs (Solar Renewable Energy Credits): Market value of solar production
    • Rebates (utility rebates, municipal programs)
    • Property tax exemptions (solar doesn't increase property tax in many states)
    • Sales tax exemptions on solar equipment
  • Utility incentive programs:
    • Performance-based incentives (PBI): $/kWh payments over time
    • Capacity-based incentives: $/watt upfront payments
    • Net metering policies: 1:1 credit vs. reduced export rates

Solar Financial ROI Analysis:

  • Total cost of ownership:
    • Gross system cost
    • Less: Federal ITC (30%)
    • Less: State/local incentives
    • Net system cost (out-of-pocket after incentives)
  • Return on investment (ROI):
    • Formula: (Lifetime savings - Net cost) ÷ Net cost × 100
    • Typical residential ROI: 200-400% over 25 years
    • Commercial ROI: 300-600% (better rates, tax benefits)
  • Comparison to other investments:
    • Solar ROI vs. stock market average (S&P 500: ~10% annual return)
    • Solar ROI vs. savings accounts (0.5-2% interest)
    • Demonstrates solar as high-performing, low-risk investment

Financing Option Modeling (if applicable):

  • Cash purchase: Fastest payback, highest lifetime savings
  • Solar loan: $0 down, monthly payments lower than current utility bill
  • Lease/PPA: Low upfront cost, predictable energy costs
  • Side-by-side comparison showing monthly payments vs. savings for each option

Lightning-Fast Turnaround (Built For Sales Teams)

We understand sales doesn't wait. Leads lose interest fast. Competitors move quickly.

Our proposal turnaround times:

  • 📌 Standard delivery: 12 hours (typical residential/small commercial)
  • 📌 Priority delivery: 4-6 hours (for active sales campaigns)
  • 📌 Express delivery: 30 minutes to 2 hours (for urgent, in-home presentations—available for high-volume partners)
  • 📌 24/7 operations: Global team coverage ensures proposals delivered around the clock

For high-volume sales organizations, we deploy dedicated design teams that work in real-time with your sales reps—proposals delivered while you're still in the home closing the deal.

Platforn-Agnostic & Workflow-Friendly

We adapt to your tools, your process, your workflow—not the other way around.

Design Software We Work With:

  • ✅ Aurora Solar (most popular—3D modeling, AI-driven design, sales mode)
  • ✅ Helioscope (commercial-focused, fast turnaround, detailed shading)
  • ✅ OpenSolar (free platform, global user base, integrated financing)
  • ✅ PVsyst (engineering-grade simulations, utility-scale projects)
  • ✅ Scanifly (drone-based designs, photogrammetry, 3D site capture)
  • ✅ SolarGraf (CRM-integrated, mobile-friendly proposals)
  • ✅ Custom internal tools (we can learn your proprietary workflows)

CRM & Sales Integration:

  • Salesforce, HubSpot, Zoho CRM, Sunbase, JobNimbus, ServiceTitan
  • Automated data sync: Proposal details flow back into your sales pipeline
  • Lead tracking integration: Proposal status updates (viewed, signed, needs follow-up)

Freequently Asked Questions

What does the Solar Proposal Design service include?

Complete proposal drawings (2D/3D), production & shading analysis, financial projections (payback, NPV, LCOE), equipment specifications, and client-ready presentation files (web link, PDF, slides).

How do you determine the right system size?

We analyze historical energy usage (if provided), roof constraints, shading analysis, and client goals (target offset %) to recommend optimal sizing. Can design from address-only or with detailed utility data.

How fast can I get a proposal?

Standard delivery: 12 hours. Priority: 4-6 hours. Express (high-volume partners): 30 minutes to 2 hours. 24/7 operations for global time zone support.

Is this service suitable for new installers?

Absolutely! Our professional proposals help new installers establish credibility from day one—clients can't tell if you've done 5 projects or 500 projects based on proposal quality.

How accurate are the savings estimates?

All projections are climate-specific, degradation-adjusted, and based on industry-validated modeling (NREL methodologies). We use real weather data, not national averages. Accuracy within ±5% of actual performance.

Can you support permits after the proposal stage?

Yes! Our proposal designs are fully compatible with our downstream Solar Permit Design services. Seamless handoff from sales → permitting with zero data loss.

What if my client wants revisions after seeing the proposal?

Minor revisions (panel count adjustments, equipment swaps) are typically included. Major scope changes (different roof, system size changes) may require additional design time. High-volume partners get priority revision support.

How much does proposal design cost?

Pricing varies by project complexity, volume, and turnaround speed. Contact us for custom quotes—volume discounts available for installers with recurring needs.